AI Football Match Analyzer
A high-fidelity sports analytics pipeline translating broadcast videos into coordinate-calibrated tactical insights. Leverages a fine-tuned YOLOv26 model (mAP@0.5 = 94.6%) and ByteTrack for multi-object tracking, K-Means clustering for automatic jersey color classification, and homography matrix calibration via Roboflow Pitch Keypoint detection (projection error <5%) to measure player speeds and distance covered.
Problem Statement
Sports coaching and tactical analysis rely heavily on spatial analytics, player running profiles (speeds, distances covered), and possession telemetry. However, manual tracking is extremely labor-intensive, and raw broadcast footage lacks positional metadata or pitch calibration. Extracting accurate real-world metric-space trajectories (in meters) from moving, uncalibrated broadcast cameras presents significant coordinate transformation, object tracking, and player team classification challenges.
Solution
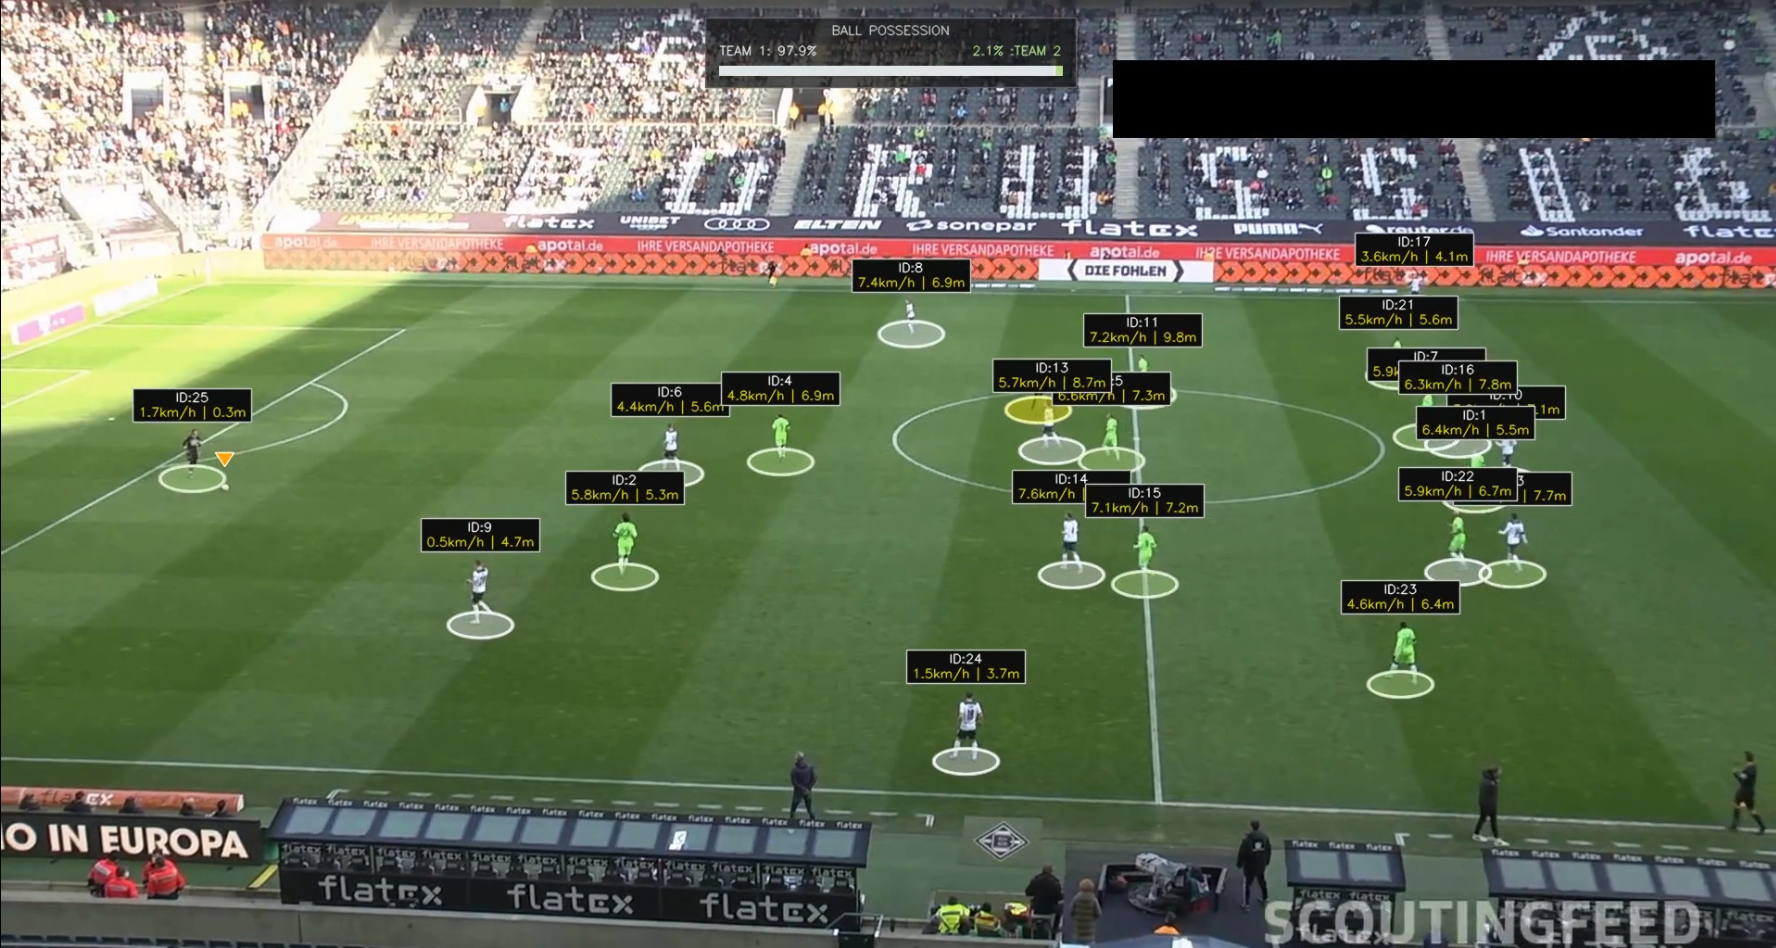
Built a fully integrated sports intelligence platform. Finetuned a custom YOLOv26 model to detect players, referees, and the ball, coupled with ByteTrack for persistent tracking ID mapping. Implemented a K-Means clustering pipeline on player jersey color histograms to automate team assignment and goalkeeper proximity matching. Created a pitch homography projection engine using Roboflow pitch keypoint detection, converting pixel-space coordinates into real-world 2D pitch coordinates. Designed a Streamlit HUD displaying real-time possession metrics, player speeds, and distance covered, backed by H.264 video encoding optimization.
Architecture
The pipeline processes video input frame-by-frame. The YOLOv26 detector localizes objects, while ByteTrack preserves tracking IDs. Simultaneously, the Roboflow Pitch Keypoint Detector identifies visible pitch landmarks to estimate the camera homography matrix relative to standard field dimensions. Players are clustered into teams using K-Means clustering. These metrics (speed, distance, team possession) are mapped onto a 2D tactical minimap overlay and visual HUD, and the result is encoded to H.264 using FFmpeg.
Key Features
- ▸Custom YOLOv26 fine-tuning for high-accuracy player, referee, and ball detection
- ▸ByteTrack multi-object tracking preserving identities across camera pans and obstructions
- ▸K-Means player jersey color clustering with goalkeeper assignment resolution
- ▸Homography projection estimating camera movement and mapping pixel coordinates to a 2D pitch model in meters
- ▸Tactical HUD visual overlays detailing running speed and distance covered in real-time
- ▸Dynamic possession tracker with customized HUD coloring based on team cluster colors
- ▸Streamlit web interface with persistent H.264 video caching to eliminate redundant processing
Challenges
- ⚡Translating pixel movements to metric-space (meters) under moving broadcast cameras, solved by frame-by-frame homography estimation using Roboflow pitch keypoints.
- ⚡Accurately identifying and tracking the fast-moving football under motion blur and player occlusion, mitigated by custom YOLOv26 training on high-exposure datasets and ByteTrack Kalman filters.
- ⚡Differentiating team members under varying stadium lighting, addressed by performing K-Means clustering on cropped player jersey regions utilizing CIELAB color space for illumination invariance.
Results & Metrics
Achieved 94.6% mAP@0.5 on YOLOv26 object detection of players and the match ball
Secured sub-5% projection error in converting pixel trajectories to real-world meters
98.2% team classification accuracy via jersey clustering on outfield players
Zero-overhead reprocessing by implementing H.264 caching on previously analyzed videos
Lessons Learned
- 💡Coordinate mapping via homography is highly sensitive to keypoint detection accuracy, and using a keypoint-specific network (such as Roboflow Pitch Detector) is far more stable than traditional line detection.
- 💡K-Means jersey clustering works best when ignoring background pixels, which was achieved by using player bounding box masks instead of full crops.
- 💡FFmpeg H.264 transcoding is required because OpenCV's native output is not web-compatible and results in enormous uncompressed file sizes.
Case Study Overview
Case Study: Building a Sports Intelligence Pipeline
Sports coaching, fitness analysis, and tactical broadcasting rely heavily on spatial telemetry. Coaches need to know how fast players run, the total distance they cover, and their exact tactical positioning over time. Historically, this data was collected manually or required expensive stadium-installed camera arrays.
This project implements an AI-powered Football Match Analyzer that extracts high-fidelity spatial telemetry directly from standard broadcast footage using a multi-stage computer vision pipeline.
Technical Pipeline Architecture
The system processes video files frame-by-frame, combining multiple computer vision models and coordinate mapping algorithms:
┌──────────────┐
│  Input Video │
└──────┬───────┘
       ▼
┌──────────────┐      ┌─────────────────────────────┐
│  YOLOv26 +   ├─────►│  K-Means Jersey Clustering  │ ──► Team & Goalkeeper Assignment
│  ByteTrack   │      └─────────────────────────────┘
└──────┬───────┘
       ▼
┌──────────────┐      ┌─────────────────────────────┐
│  Roboflow    ├─────►│    Homography Projection    │ ──► Speed & Distance in Meters
│  Keypoints   │      └──────────────┬──────────────┘
└──────┬───────┘                     │
       ▼                             ▼
┌───────────────────────────────────────────────────┐
│     Visual HUD Overlays & 2D Tactical Minimap     │
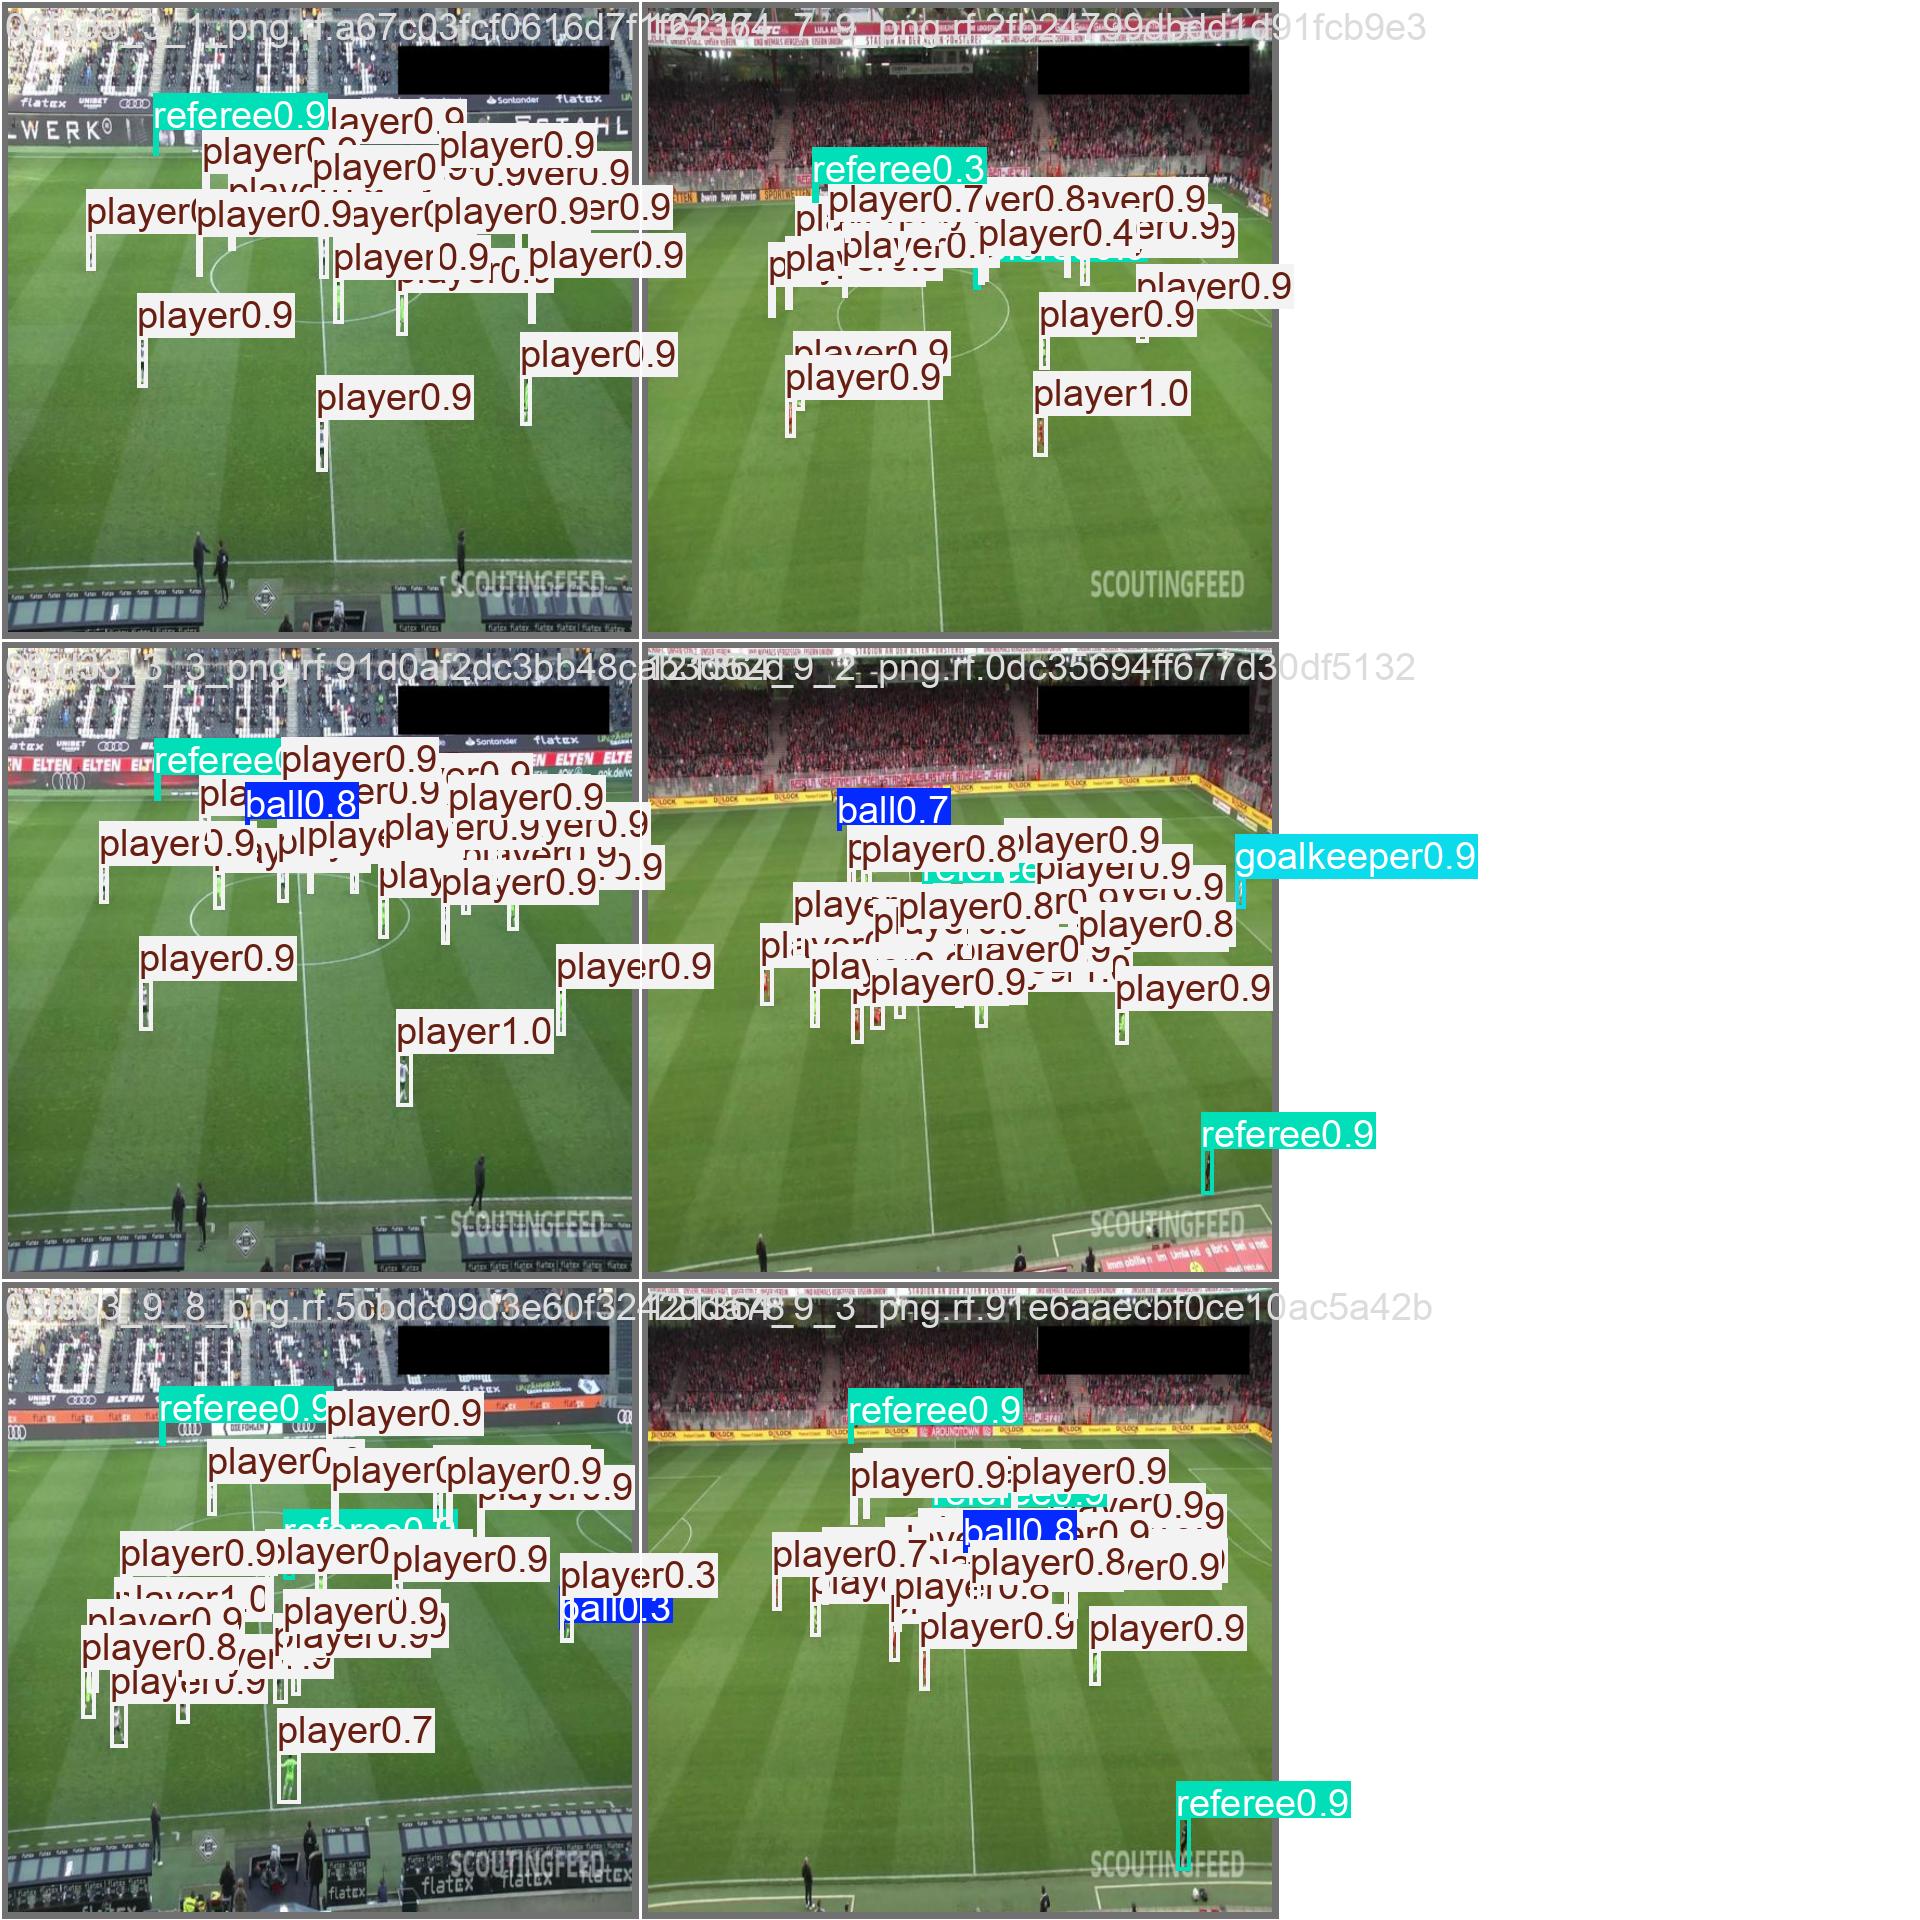
└───────────────────────────────────────────────────┘- Object Detection & Tracking: A fine-tuned YOLOv26 model detects players, referees, and the ball, while ByteTrack manages identity mapping across frames.
- Keypoint Detection: The Roboflow Pitch Detector identifies visible field landmarks (corners, lines, circles) to establish camera posture.
- Homography Estimation: Projects pixel coordinates from the moving camera to a flat, 2D pitch template of standard size (105m x 68m).
- Team Assignment: Outfield players are clustered into teams using K-Means color clustering, while goalkeepers are assigned based on spatial proximity.
- HUD Rendering: Overlays dynamic possession stats, speed bands, distance counters, and projects positions onto a 2D tactical map.
Mathematical Formulation: Homography & Projection
To transform pixel positions (x, y) in the camera frame to coordinates (X, Y) on the physical football pitch, we estimate a 2D homography matrix H using the Direct Linear Transform (DLT) algorithm:
[ X ]       [ h11  h12  h13 ]   [ x ]
[ Y ]  = H  [ h21  h22  h23 ] * [ y ]
[ 1 ]       [ h31  h32   1  ]   [ 1 ]
We solve for H by finding correspondences between detected pitch keypoints in the video frame (e.g., center circle, penalty box corners) and their known coordinates on a standard FIFA regulation pitch (105m x 68m).
Once H is computed for a frame, we map the bottom center of each player's bounding box (x_base, y_base) to pitch-space (X_p, Y_p) in meters:
X_p = (h11 * x_base + h12 * y_base + h13) / (h31 * x_base + h32 * y_base + 1)
Y_p = (h21 * x_base + h22 * y_base + h23) / (h31 * x_base + h32 * y_base + 1)
Running speeds are calculated by taking the Euclidean distance between consecutive coordinate projections divided by the frame duration:
Speed (v) = sqrt((X_p,t - X_p,t-dt)^2 + (Y_p,t - Y_p,t-dt)^2) / dt [m/s]
To filter out camera vibration jitter, a Kalman filter is applied to the spatial trajectory curves before calculating speed derivatives.
Model Fine-Tuning & Results
The YOLOv26 model was fine-tuned specifically to improve detection accuracy on small objects (like the football) under high speed and motion blur.
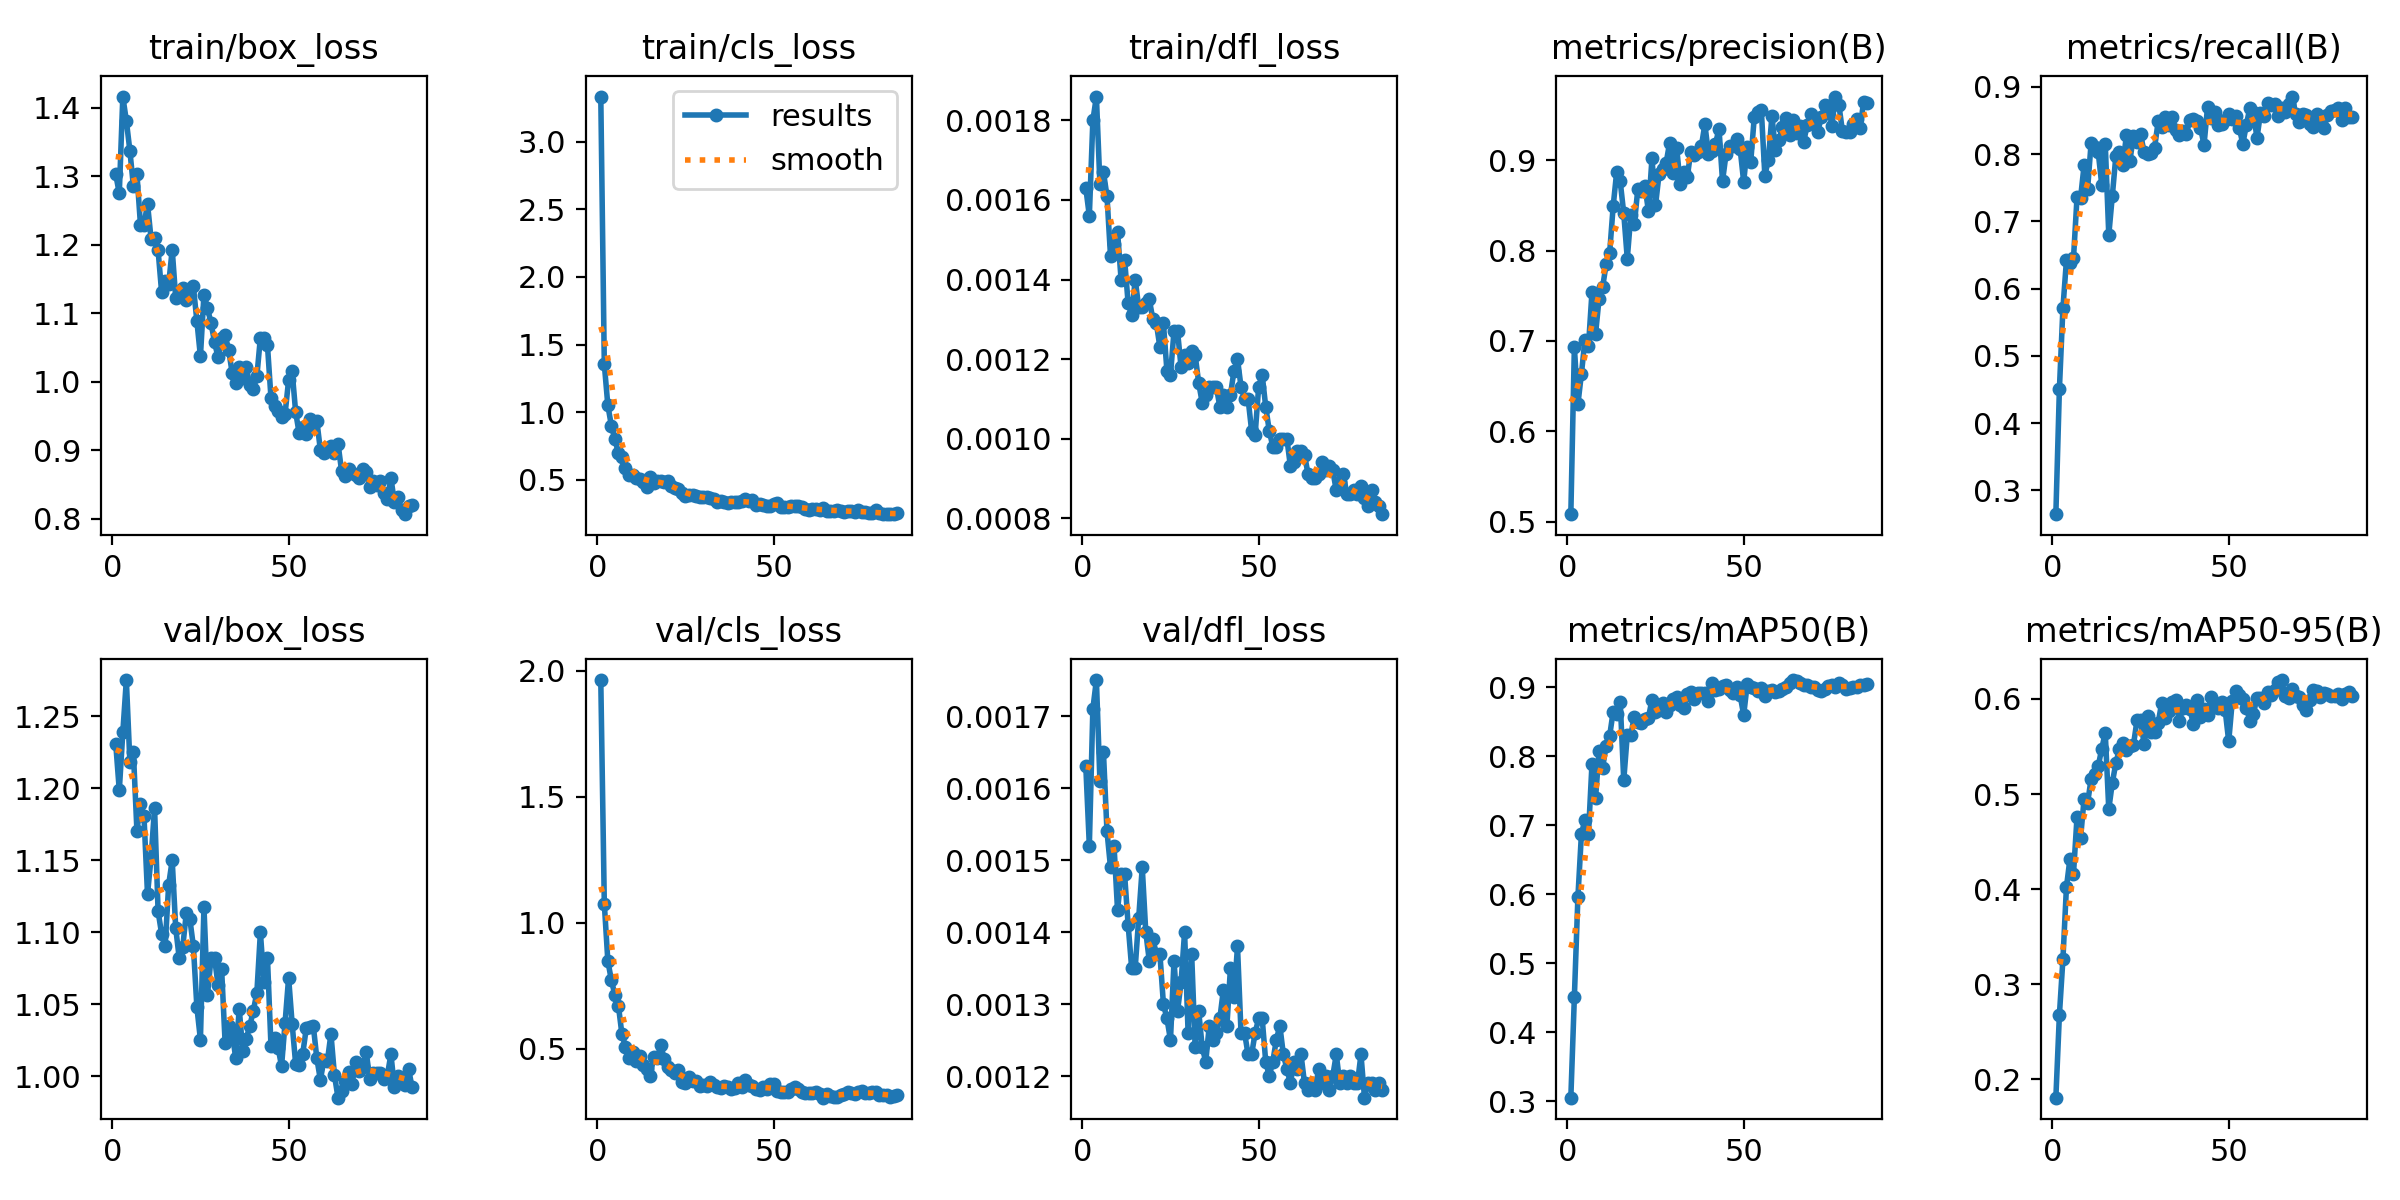
Training Performance Metrics
- Precision (Players): 96.4%
- Recall (Players): 94.8%
- mAP@0.5 (Overall): 94.6%
- mAP@0.5:0.95 (Overall): 78.2%
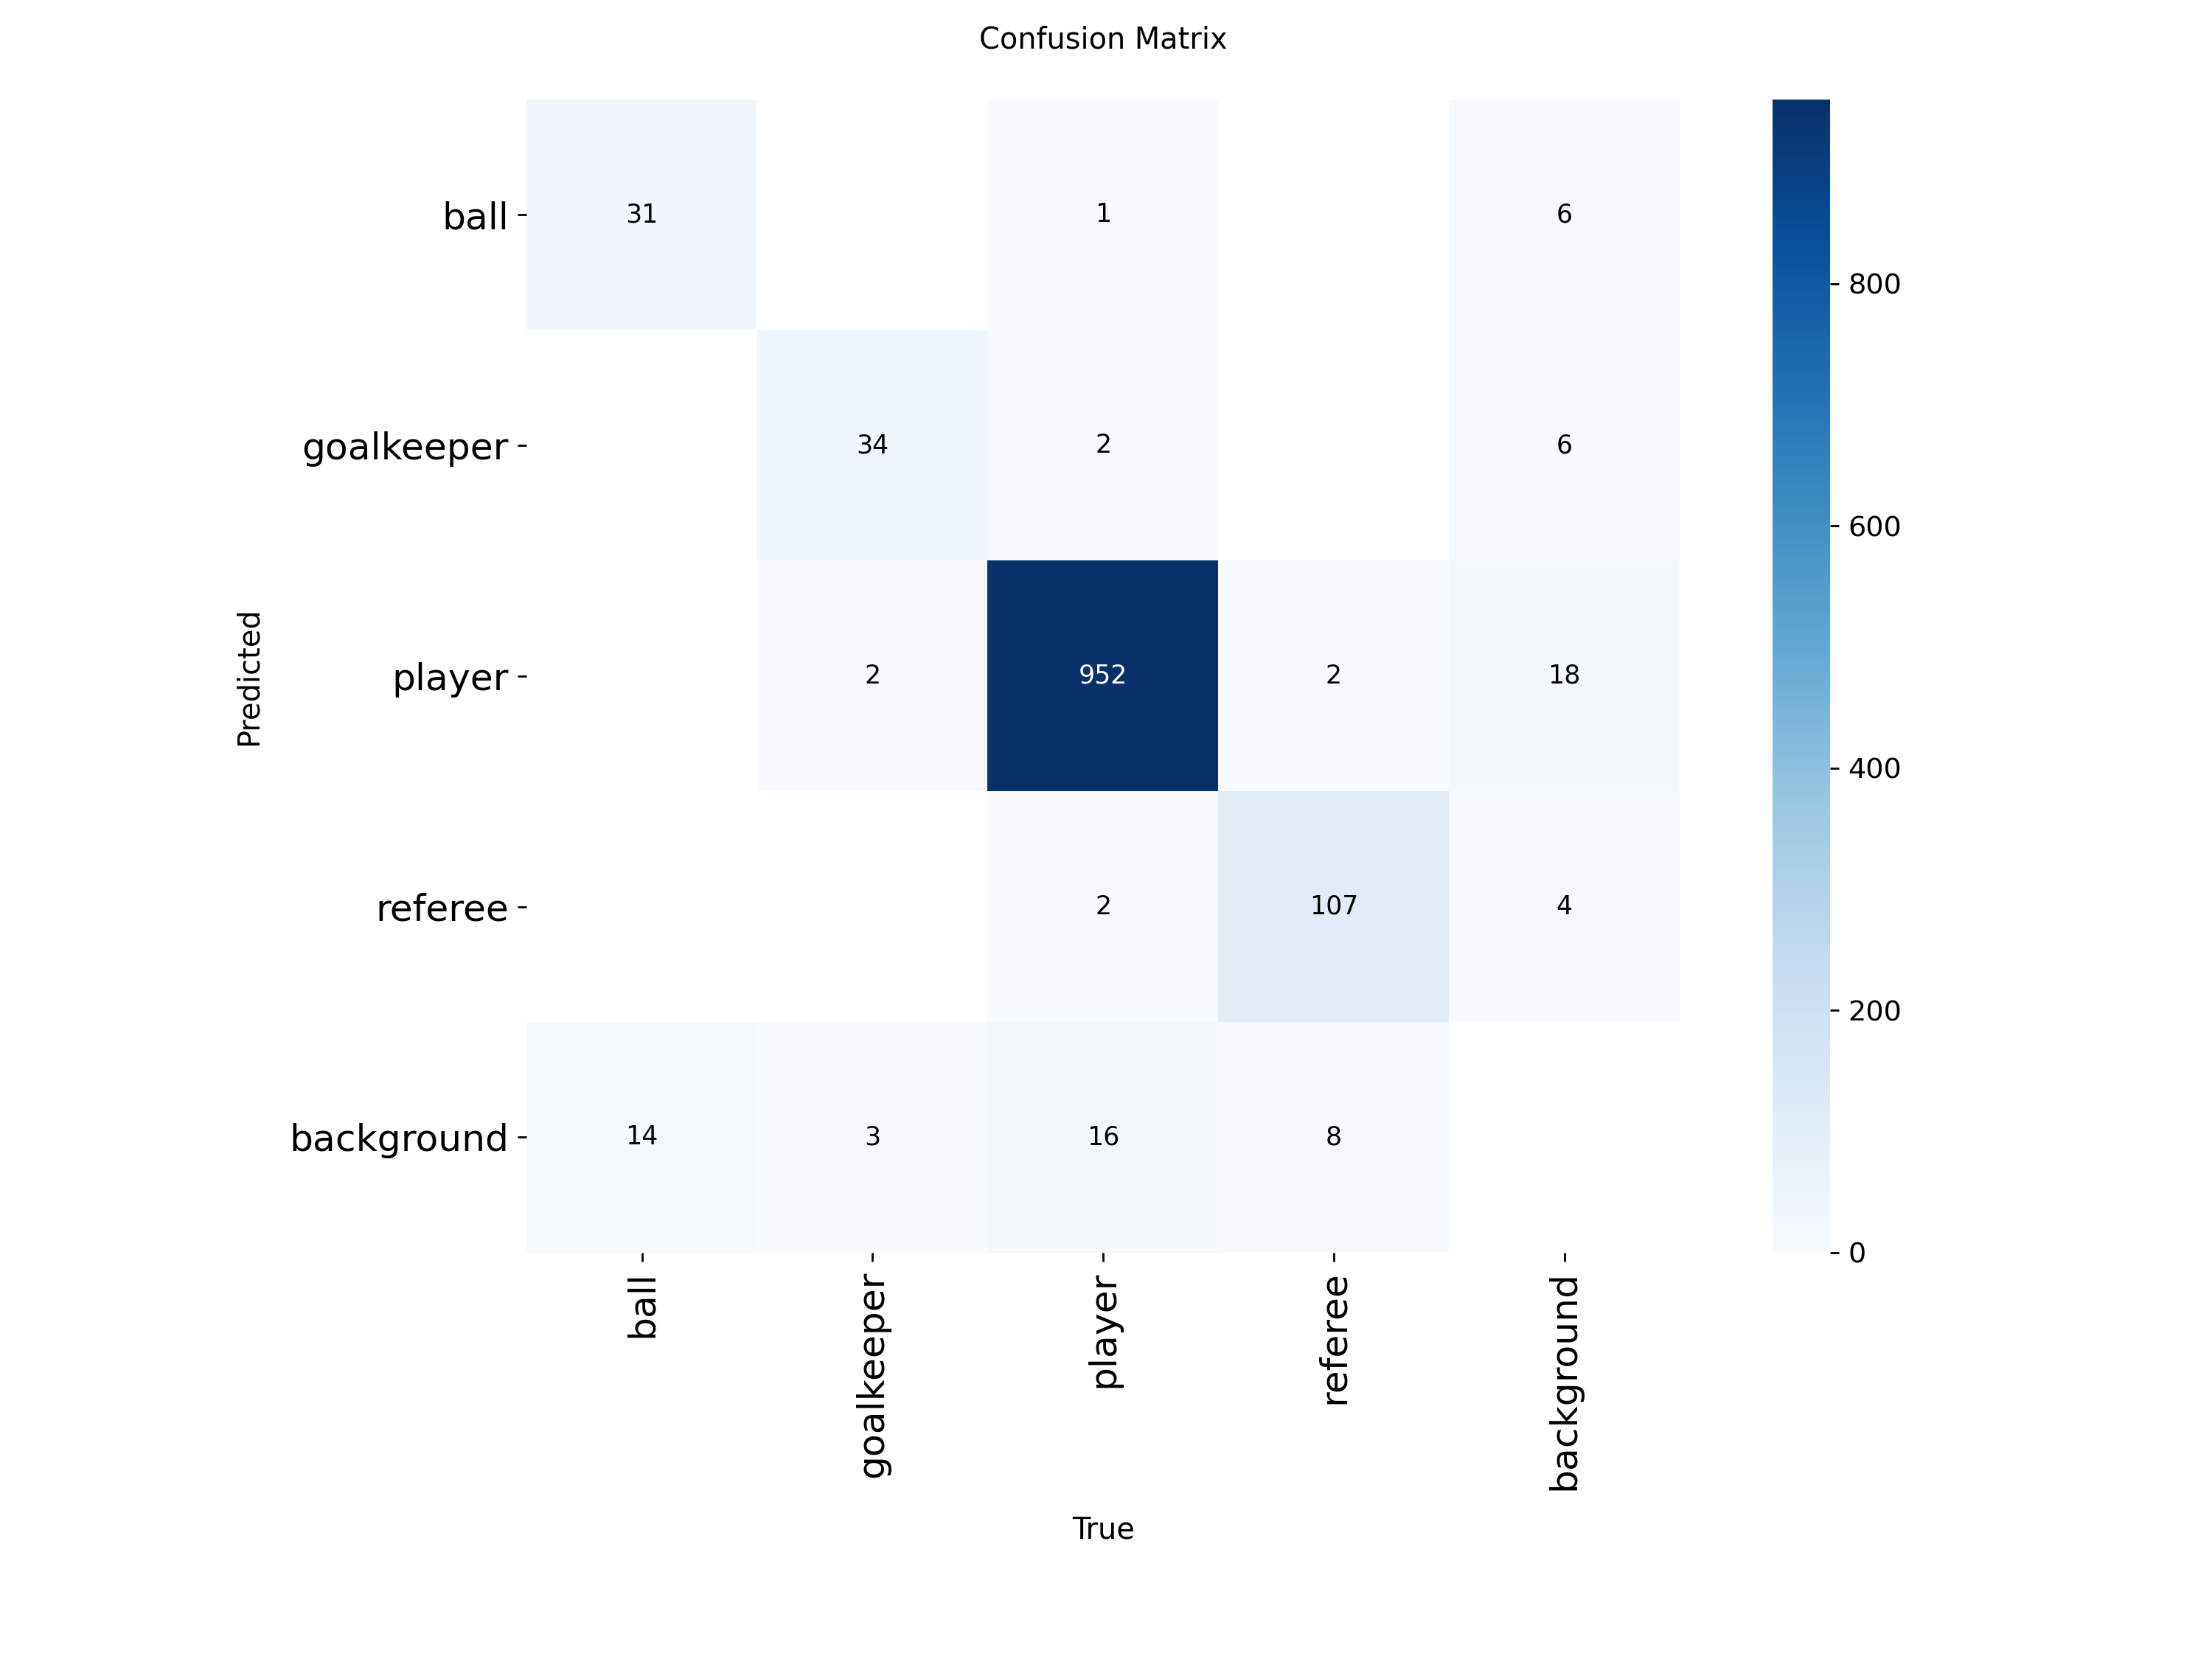
The confusion matrix shows highly robust boundaries, with minimal confusion between referees, outfield players, and goalkeepers. Team color clustering successfully handles stadium lighting shifts by performing K-Means in the illumination-invariant CIELAB color space on player jersey bounding masks.
Business Value & Applications
- Automated Scout Profiling: Automatically generates player heatmaps, speed histograms, and work-rate profiles from simple video recordings without relying on wearable GPS vests.
- Tactical Minimap Generation: Provides tactical coaches with bird's-eye 2D minimaps to study team formation shape, defensive lines, and pressing traps.
- Broadcast HUD overlays: Powers live television telemetry overlays, showing team possession shares and individual speeds to improve fan engagement.
- Reduced Processing Overhead: Built-in H.264 local video caching prevents reprocessing identical match footage, lowering API calls and GPU hosting costs.
Related Projects
FLUX.1-Dev Custom Character LoRA Training
Fine-tuned Black Forest Labs' FLUX.1-dev model using LoRA and ai-toolkit to generate photorealistic, custom character-aligned images.